CLOUDS- Hussein
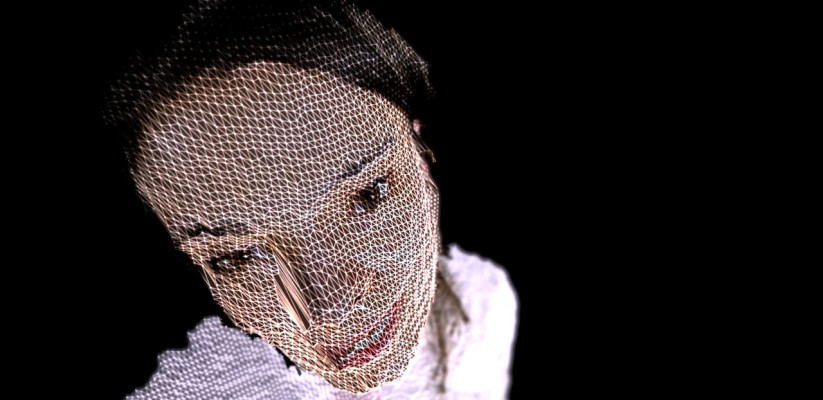
This documentary is definitely something that you don’t come across every day! Its not that I haven’t seen something like this before it’s more like I did not imagine seeing something like this before I die. The closest to it for me was actually Tyler’s project last semester.
They made a very good point with the terminology when she said “data art” instead of “data visualization”. This is also something that is very confusing to people, as it is not understood under what category it falls.
Hacking reality is also for me a new and very philosophical term that is somehow making sense. It is something that will definitely change the future generations and their perspective about reality. Our generation started diving into the world of code on a very small level and not commercially but the future generations will definitely have the notion of hacking everything they can see around them in their world which could be mostly digital. Imagine the upcoming generations of DJs who can be live coding instead of mixing or playing with the code when they turn it visually.
And surfing the web in 3D is something that should definitely happen. I understand that it is also something that will require a whole new system but if it actually happens that would change the digital world and the whole experience we get from it.
There are a lot of interesting pieces in this documentary but one that hit me the most was the idea of feeding all of the senses at once. This idea was proposed in the “how does music look like” part and it is an idea that has been touched for many years but never with this intensity. Imagine also adding the vibration and discovering a certain taste and smell to music. This would probably change the way we perceive music incredibly.
This might be the base that can connect a lot of different types of art. Aside from that, it can be the bridge between sciences and humanities because they will enable us to see data differently and be on a much higher level of understanding in it. An example to that would be trying to explain statistics in and how different it is when it is just readings and numbers than it is when people introduced infographs to it making it much easier to understand by people on a lot of different levels of knowledge. This appears to be the next generation because it will enable perfectly accurate representation to many of the data we had never even imagined seeing.
This is also a very good example that actually helped me personally understand some information from the wind movement, which I needed for my thesis. I think this is the one they were talking about in the video actually because there is nothing similar to that anywhere else.
http://earth.nullschool.net/#current/wind/surface/level/orthographic=-2.19,24.27,310

